

Market Summary
August 19, 2016

Michael Orr
Journal Columnist
Founder and Owner, Cromford® Report
I have read a number of comments that July’s sales numbers were weaker than expected, showing a 3 percent fall compared with July 2015. People tend to think all Julys are created so a comparison of July 2015 and July 2016 sounds like apples to apples, right?
Wrong! When a month starts and ends with a weekend it can end up with far fewer working days. It is working days that title companies, escrow officers and the county recorders’ offices require to get sales closed. When you have been watching the market as long as me and Tom Ruff, you notice that one of the biggest factors in determining the end of month sales count is the number of working days – sometimes less than the levels of supply or demand. Real estate agents often do not expect this, because they tend to work weekends.
July 2016 had only 20 working days, while July 2015 had 10 percent more – 22 working days in total. For July 2016 to end up down by only 3 percent means it had to close 6 percent MORE sales per working day. Any month that ends on a weekend tends to start the following month with an unusually large number of listings under contract and this was true of August 2016. Lots of pending sales exist for everyone to close in August.
I can confidently predict that any disappointment with July’s sales will be blown away by the sales counts that come in at the end of August. Why? August 2016 has the maximum 23 working days. It also has almost 10 percent more working days than August 2015 (with 21), so I would expect some positive headlines in September.
In reality, nothing much has changed. The year 2016 has been remarkably similar in market behavior to 2015 for 90 percent of the market, with an increase in volumes of about 10 percent or so overall. The main changes that I see when comparing 2016 with 2015 on an “apples to apples” basis are:
New homes are significantly increasing their market share over re-sales
The low end is even more short of inventory than last year, when it was very scarce
The high end has more inventory
2016 has been a good year for the Greater Phoenix housing market, especially for sellers. The only caveat to that statement is that large parts of the luxury marker were much slower during the second quarter than they were in 2015. The good news for luxury is that the third quarter of 2015 was very slow, disturbed by the large drop in the stock market and concerns over the commodity market. This means that, going forward, the third quarter of 2016 will have a much easier comparison.
With little exciting change to report, it might be a good time to reflect on where we have come since the peak of the housing bubble in 2005-2007. Some parts of the Valley have almost reached the prices they held at their peak. These locations are few, but they are not far between – they are southeast of Camelback Mountain.
The only ZIP code that has almost recovered to its former high point is Scottsdale 85251, where the annual average price per square foot is just 2 percent down from its former high spot. If we were to focus purely on the western side of 85251, which forms part of the fashionable area known as Arcadia, then pricing would slightly exceed the previous peak.
The other part of Arcadia, the eastern and northern areas of 85018, is the best performing part of Phoenix as well. However, the ZIP code 85018 as a whole is down 12 percent from its peak.
The charts show the top 20 ZIP codes based on how far below their pricing currently stands as compared to peak pricing in 2005-2007 (single family homes – annual average $/SF):
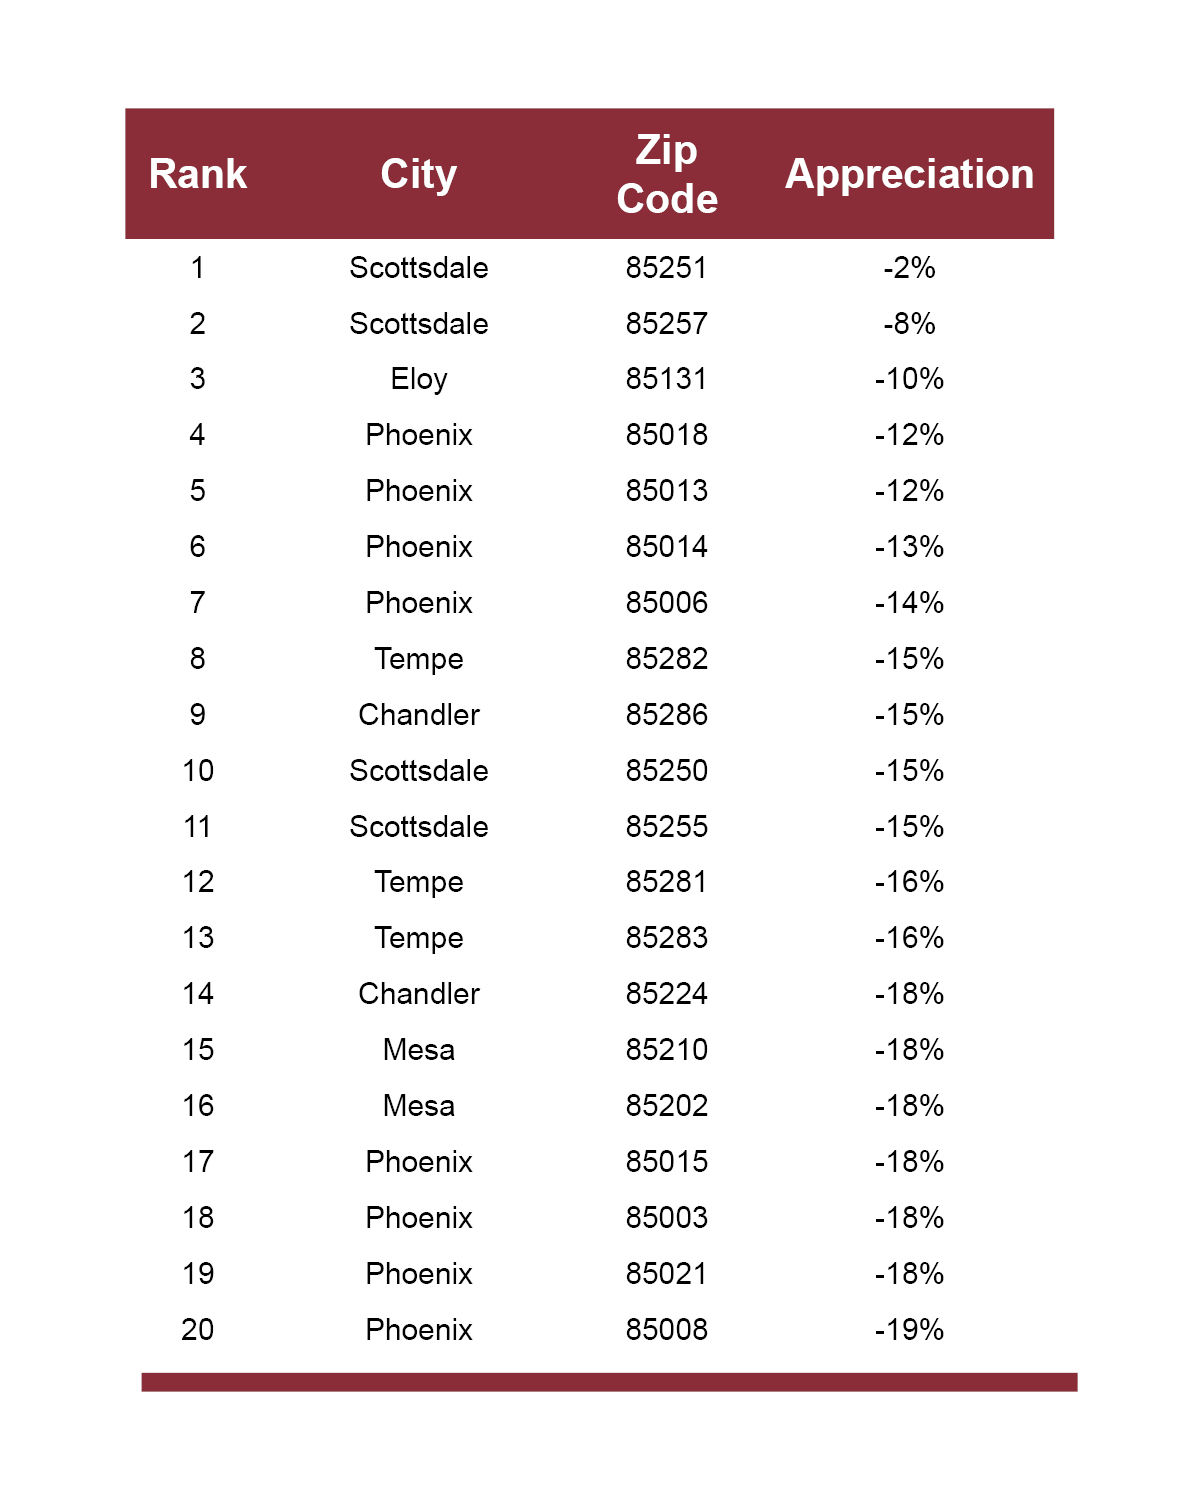
Eloy is a bit of an exception. The main reason its prices are only 10 percent below the peak is because of sales at Robson Ranch, an active adult community where the price per sq. ft. far exceeds the norm for the rest of 85131. Central Phoenix, Central Scottsdale and the closest part of the Southeast Valley are very well represented in this top 20 list confirming the current attraction; hence, pricing power of more urban and central locations.
At the other end of the scale, prices have the furthest to recover in the following Zip codes:
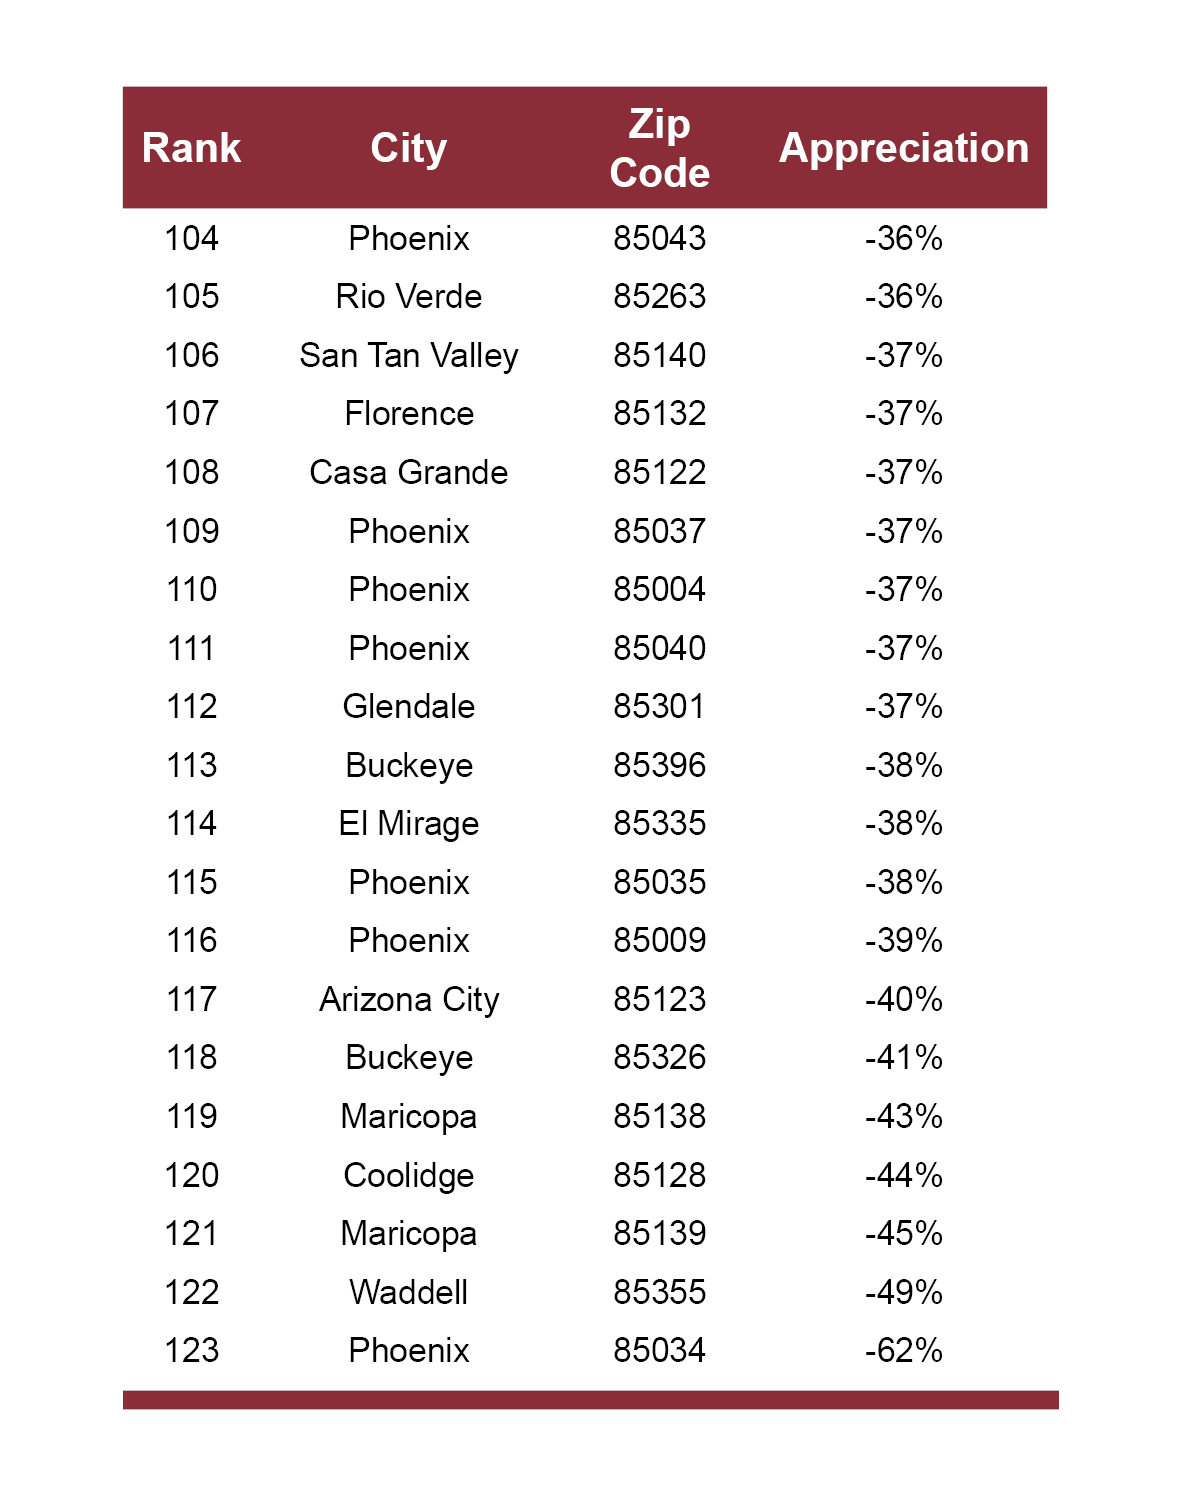
Here the table is dominated by more distant locations and the least expensive of the closer locations. However, many of these areas are now appreciating at the fastest rates in the Valley. One could argue that because they remain down the furthest from the peak, they have the most room to bounce back.
Michael Orr is the founder and owner of the Cromford® Report www.cromfordreport.com. Michael can be reached at mike@cromfordreport.com or by phone at 480-262-5839. Sample of Cromford® Report data included with this article. See Introduction To The Cromford® Report course offered on September 14th. Register Here.
The Future Of Real Estate Services Seminar
FRIDAY, SEPTEMBER 27, 2016 – 9:00 AM TO 12:30 PM
Topics include: Social Trends and Online Acceptance, Best Apps for Securing and Servicing Clients, The Future Impact of Zillow and Trulia, Economic and Lifestyle Trends Effecting Purchases, Latest and Greatest in CRMs, Service Organizations and Political Affiliation, Upcoming Changes to the Purchase Contract, And Much More.

Tuition: $40
Credit: 3 hrs. Agency law