

The Health of the Housing Market A National Comparison
July 22, 2016

Lawrence Yun
Chief Economist and Senior Vice President of Research National Association of REALTORS®
The housing market has been making steady, modest gains in 2016 from a national perspective. Home prices are broadly rising, thereby helping homeowners accumulate equity. It’s hard to believe that housing equity has essentially doubled from the gloomy years of 2010 to now, from $6 trillion to over $12 trillion, as the national median home price rose from $166,100 to $222,400. Based on the recent trends of a 6 percent home price gain, another $1.3 trillion in housing equity could be added to homeowners’ wealth this year. Meanwhile, national existing-home sales reached its highest monthly tally since 2007, with sales ticking up at a 5.53 million annualized rate in May 2016.
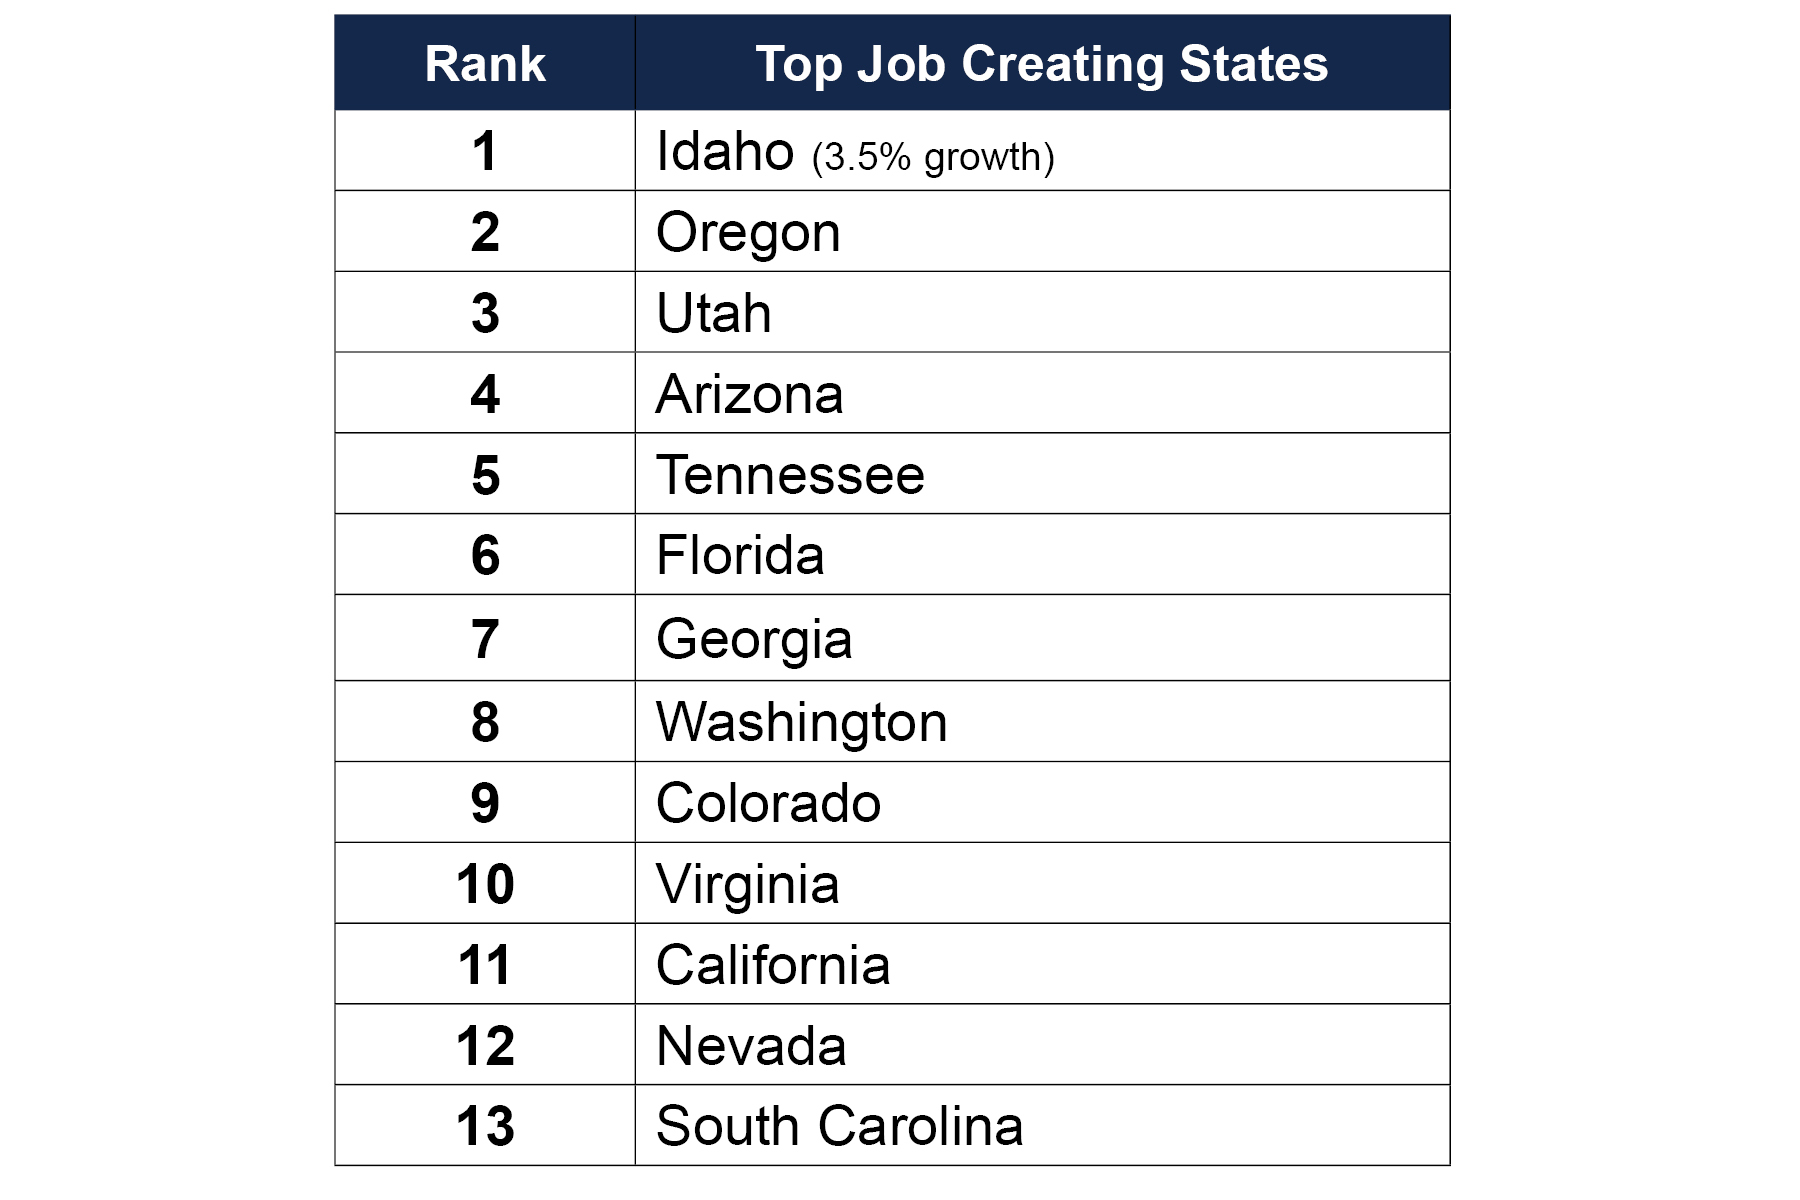
The underpinning for rising home sales is continuing low mortgage rates and job creations. Some states are doing much better than others in regards to jobs. The Western states dominate, with Idaho leading with a 3.5 percent one-year job growth rate as of March. The other states that follow are listed below with an average of 2.8 percent growth.
Specifically in Arizona in the past 12 months, 75,700 net new jobs have been added to the state.
The state’s unemployment rate fell to 5.6 percent after having climbed to 11.2 percent during the worst moments of the housing crash years in 2009. The Greater Phoenix area is doing particularly well. After having lost nearly 250,000 jobs during the Great Recession in 2008 to 2009, the Greater Phoenix market is setting new highs in total jobs with each passing month. Not only has the state recovered the job losses, there are now 40,000 more jobs compared to the prior peak set in 2007 housing bubble years. But even as jobs have more than fully recovered, home prices have not. At its peak in 2006, the median home price in Phoenix was $270,000. Today, it is $220,000, or 19 percent lower. Using a repeat-price index, so as to control for quality and types of homes being sold, home prices are down by 21 percent from the peak for the state of Arizona as a whole and in the Phoenix region. Flagstaff, Prescott, Lake Havasu, and Tucson are showing price recovery as well, though a bit more moderately compared to Phoenix. Yuma and Sierra Vista are not showing any meaningful recovery after the price crash.
In another healthy sign, mortgage default rates are sinking. As one of the early indicators to monitor for impending market stress, the number of people late on their mortgage payment by only a month was 2.35 percent in the latest quarter, the lowest in at least 40 years when this data was first collected. In addition, the share of homes with new foreclosure proceedings fell to 0.36% of homes with mortgages – the lowest in over a decade. In other words, there are few signs of bad mortgages, which is terrific news on the overall health of the market.
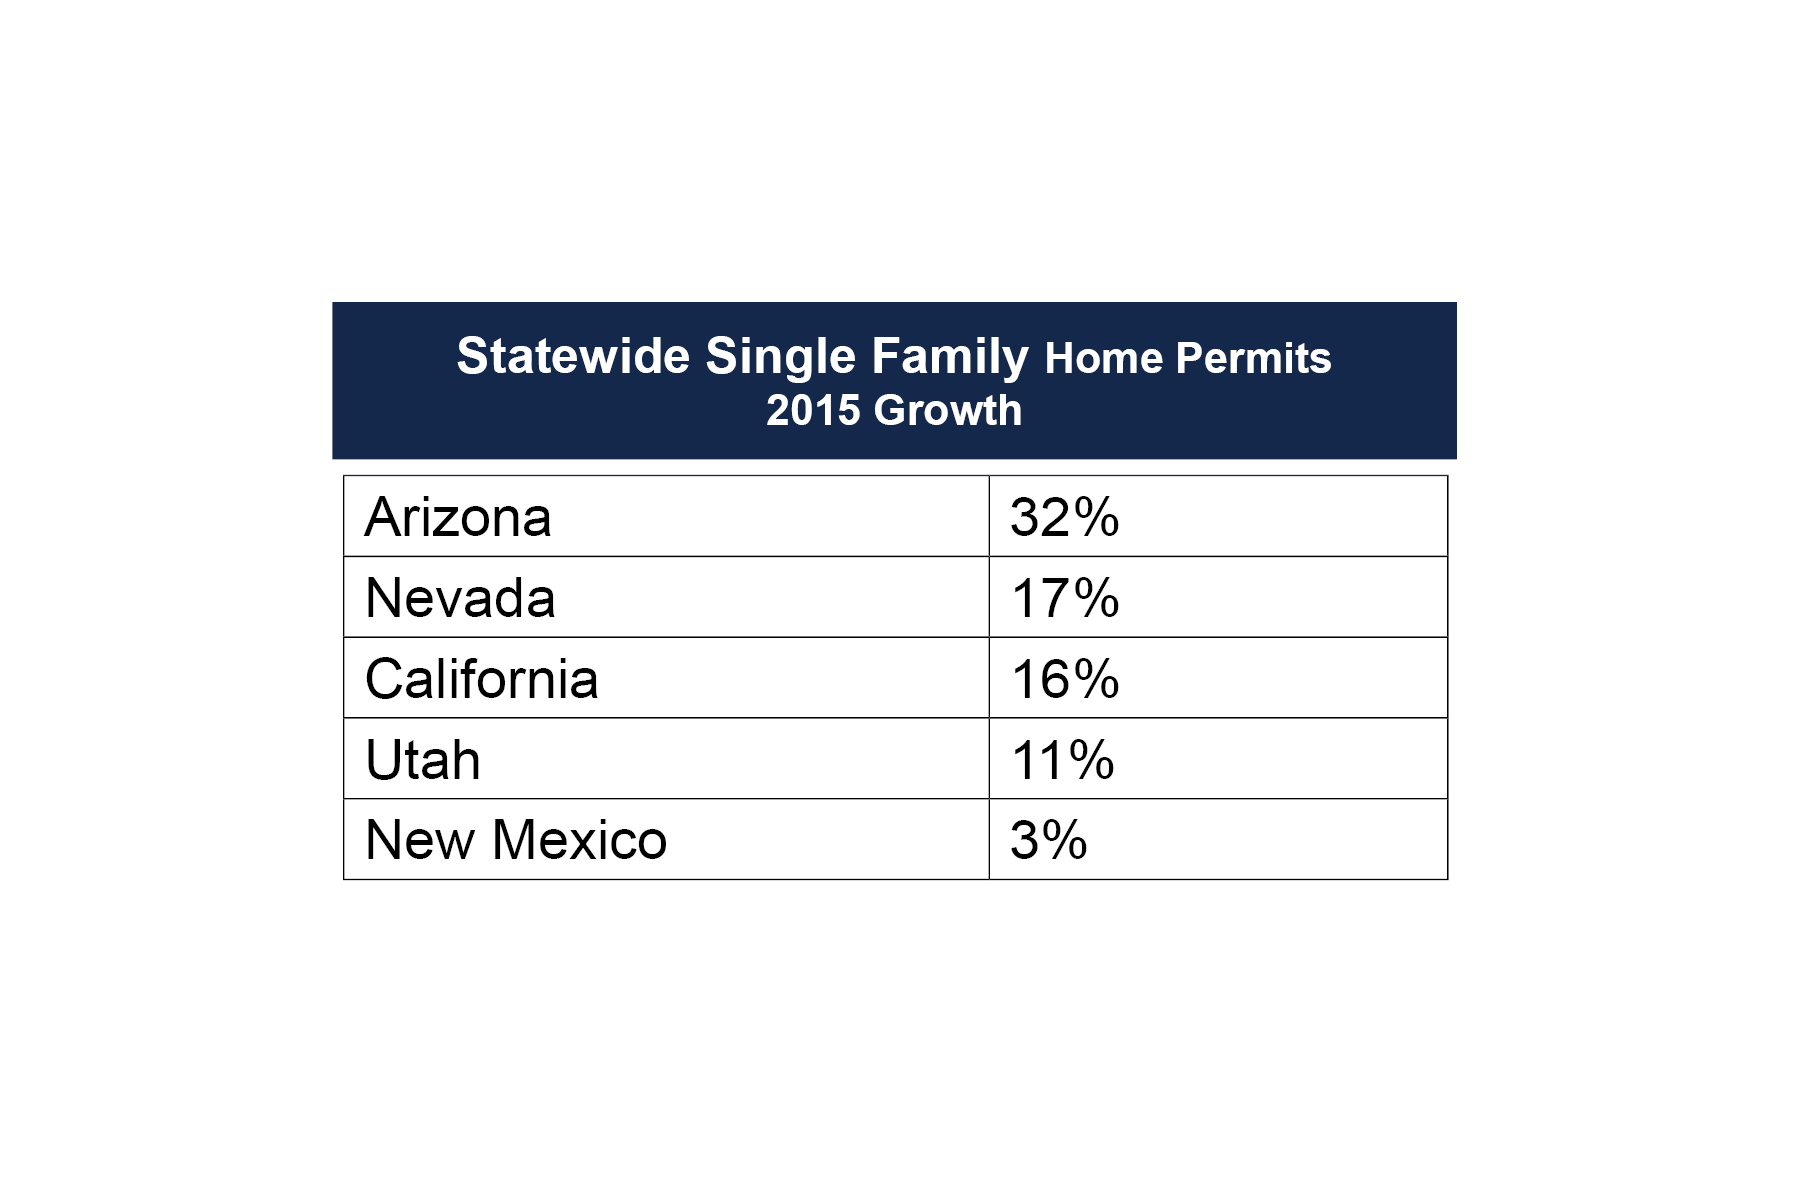
As for new home construction in the state, in 2015 statewide single family home permits were up 32 percent in Arizona compared to 10% of the U.S. as a whole. The chart below further shows comparisons with other states.
Home prices are in no danger of declining because of the ongoing inventory shortage. There is plenty of room to grow for homebuilders in the upcoming years. Nationally, new home sales are projected to rise 7 percent in 2016 and another 11 percent in 2017. Arizona should easily outperform the country because of the stronger job market and from a very large need to build more homes in order to relieve housing and inventory shortage.