Market Summary
May 2, 2017
Michael Orr
Journal Columnist, Founder and Owner, The Cromford® Report
Each month I highlight key statistics relative to the current market.
The chart below shows the change in dollar revenue by price range for closed sales during the first quarter of 2017 versus 2016. Not the explosive growth in the ranges from $100K up to $3 million, but the declines below and above this range.

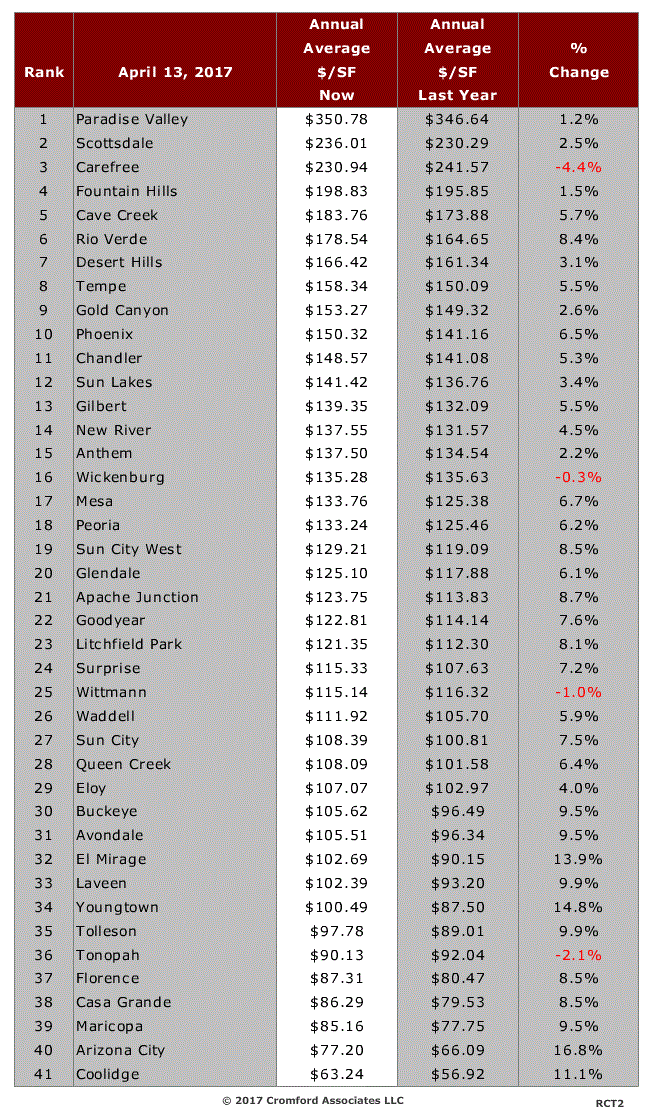
The chart below ranks the cities by annual average $/SF and notes the percentage change over the last year. Note that Scottsdale has overtaken Carefree.


