

A Review of Investment Markets
November 1, 2017

Paul Ohanian
Founder & CEO, Scottsdale Wealth Planning, Inc.
I tend to preach the virtues of a globally diversified portfolio. While resisting temptation to use past performance to predict future returns, this quarter underscored a valuable lesson for investors: There is a world of opportunity out there. Here is my assessment of the markets for Q3 2017.
Once again, Emerging Markets and International Developed outperformed U.S. markets as the global economy gains traction. This past quarter, the big “winners,” who are also referred to as the highest country performance in U.S. Dollar terms in Emerging Markets, were Brazil (+23.78 percent), Russia (+17.40 percent) and Chile (+17.26 percent). Note that these Q3 winners were among the biggest losers in Q2, each posting negative results (-6.37 percent, -9.87 percent and -2.28 percent, respectively).[1] International Developed reflected similar volatility when broken into individual countries. Q3 leader Norway (+18.36 percent) reported significantly lower returns in Q2 (+3.15 percent), following even lower returns in Q1 (+0.34 percent).[2] Different countries deliver different returns at different times, and a global investment strategy can capture those returns, highs and lows. As always, it will be interesting to see, and is impossible to predict, which countries will lead in Q4 2017 and beyond.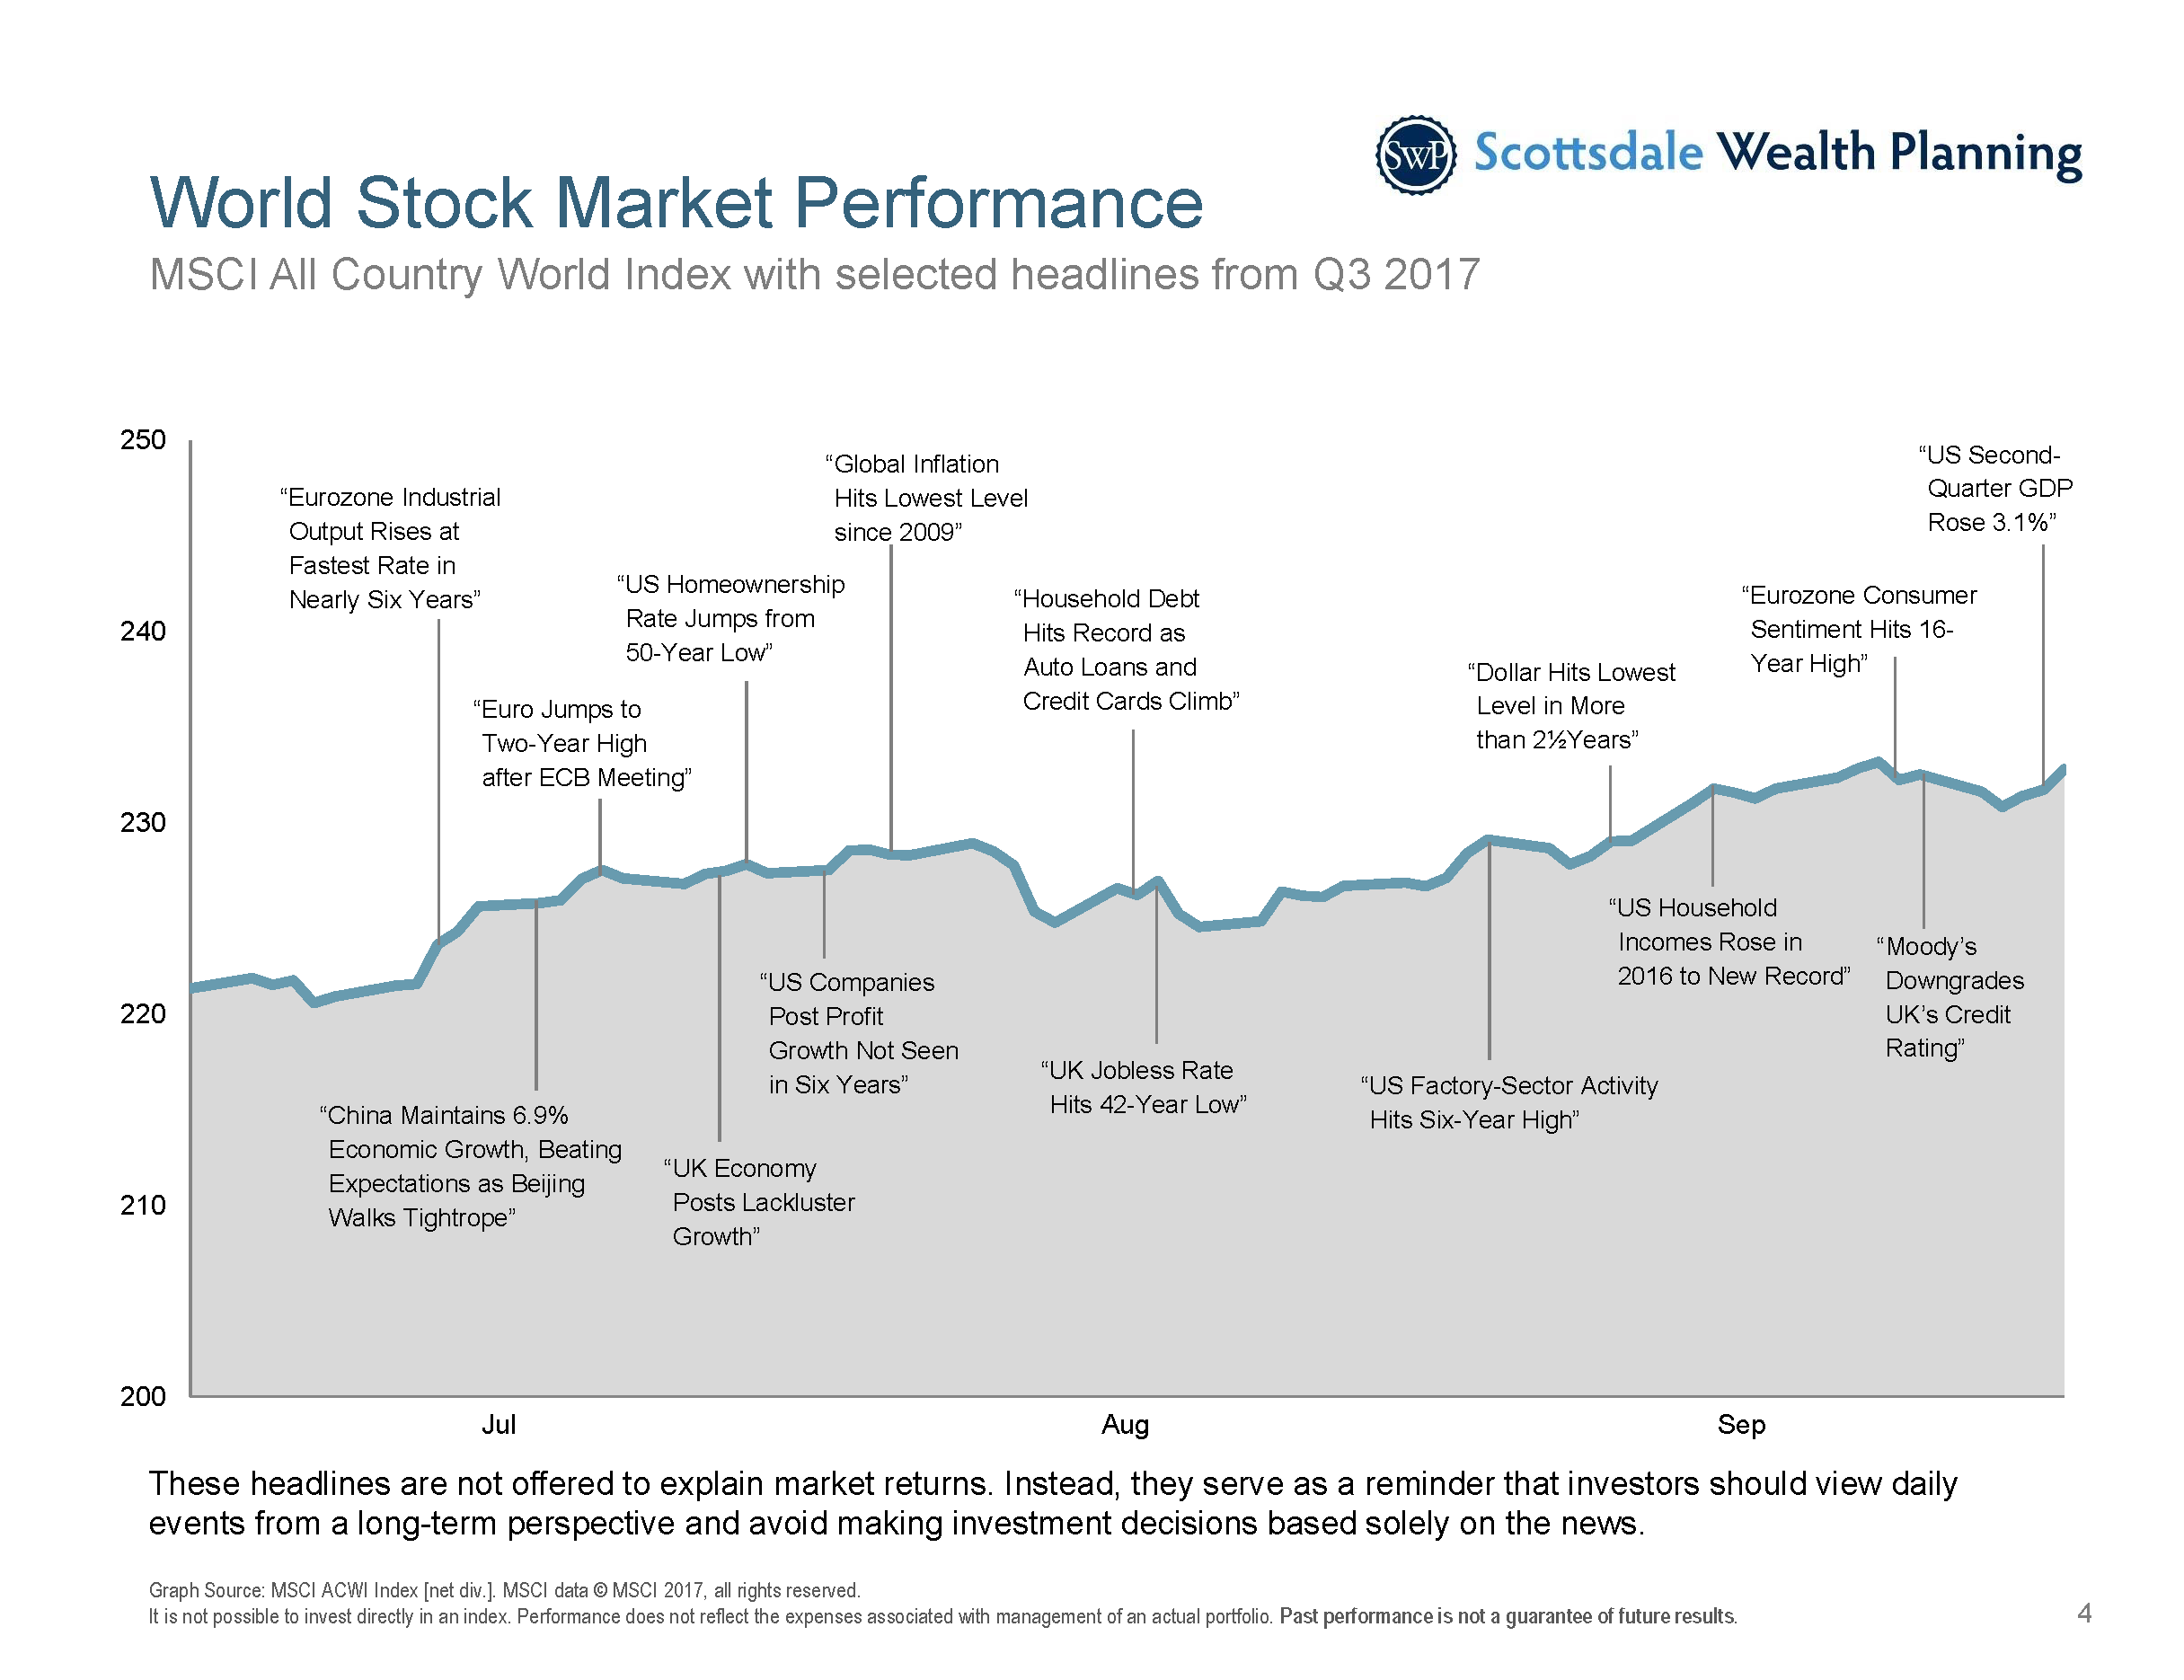
Back at home, the broad U.S. equity markets posted solid, positive returns in the third quarter.[3] U.S. small and mid-cap companies — generally, companies with a market capitalization of between $300 million and $10 billion — led the surge in the last few weeks, in spite of renewed attention on very large companies like Apple and Alphabet and large cap index, the S&P 500. Bond markets continued to lag this quarter as yields ever-so-slowly rise amid rising interest rates. The yield on the 10-year Treasury note rose two basis points in the quarter to 2.33 percent.[4] Corporate bonds fared little better, with short-term gaining 0.59 percent and intermediate 1.05 percent in total returns over the quarter. I see spreads tightening as income-seekers chase higher yields and take on additional risk.
In the real estate world, Real Estate Investment Trust (REIT) indices mimicked the overall markets, with non-US REITs outperforming domestic.[5] And while the domestic indices were flat in the quarter (gaining only 0.38 percent), I observed solid results in select individual REITs in the hotel and office building sectors. Is this an indication of an expanding economy at home I’m watching this sector closely as interest rates continue to rise.
While it’s always interesting to follow investment news day-to-day, month-to-month or even quarter-to-quarter, it’s essential to remember that the future is always uncertain. A thoughtfully constructed, well-diversified global portfolio is key to capturing the opportunities that will provide positive returns for a long-term gain.
Paul Ohanian is founder and CEO of Scottsdale Wealth Planning, Inc. an Old Town-based registered investment advisor and Certified Financial Planner® with more than 25 years of experience in providing financial services to the Valley. Visit him at scottsdalewealthplanning.com.
(Note: Information is at a period in time and subject to change. Past performance is not a guarantee of future results. Indices are not available for direct investment. Index performance does not reflect the expenses associated with the management of an actual portfolio. Information contained in this article is for informational purposes only and should not be considered investment advice. Advice may only be provided after entering into an advisory agreement with Scottsdale Wealth Planning. Scottsdale Wealth Planning’s current Disclosure Brochure is set forth on Form ADV Part 2 and is available for your review upon request.)
[1] Country performance based on respective indices in the MSCI Emerging Markets IMI Index. All returns in USD and net of withholding tax on dividends. MSCI data © MSCI 2017.
[2] Country performance based on respective indices in the MSCI World ex US IMI Index. All returns in USD and net of withholding tax on dividends. MSCI data © MSCI 2017.
[3] Russell 3000 Index up 4.57% at 9/30/2017
[4] One basis point equals 0.01%. Yield curve data from Federal Reserve.
[5] All index returns are net of withholding tax on dividends. Dow Jones US Select REIT Index used as proxy for the US Market, and S&P Global ex US REIT Index used as proxy for the World ex US market. Dow Jones US Select REIT Index data provided by Dow Jones ©. S&P Global ex US REIT Index data provided by Standard & Poor’s Index Services Group ©2017.