

Market Update: Sales, New Listings, Sales Price, Months of Supply, Employment Numbers
October 1, 2018

Fletcher Wilcox
V.P. Business Development & Real Estate Analyst, Grand Canyon Title Agency, Inc.
Sales and New Listings
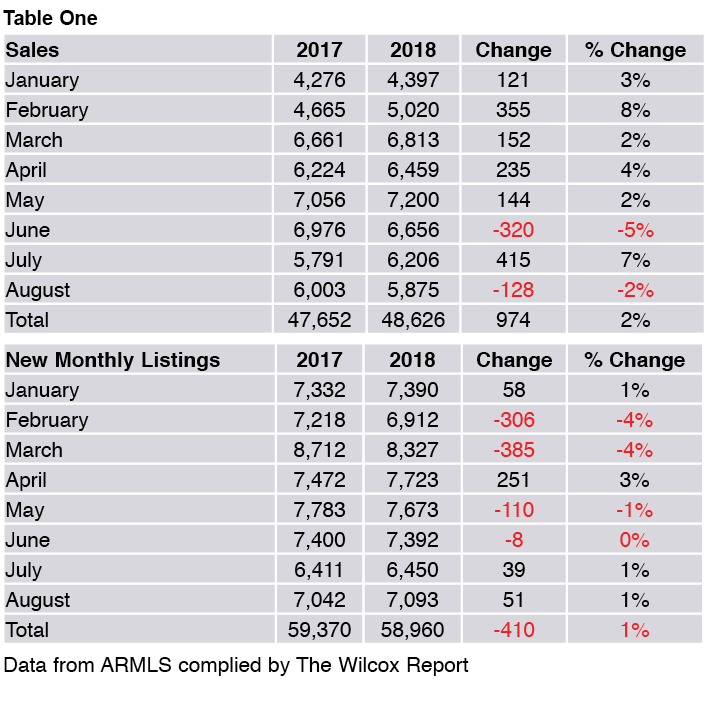
Sales of previously owned single family homes in Greater Phoenix (Maricopa County) were down two percent in August 2018 compared to August 2017, but up were up 2% overall for the first eight months of 2018 compared to 2017. New monthly listings of previously owned single family homes were up one percent in August 2018 compared to August 2017 and were down one percent overall for the first eight months of 2018 compared to the same time period last year.
I-Buyer Companies Pick up Market Share as Sellers
Five percent of sales in August 2018 showed the seller as either Offer Pad or Open Door. Open Door was the seller on 217 transactions while Offer Pad was on 68. In August 2017 these two companies as a seller had a combined market share of three percent. Back then Open Door was the seller on 109 sales and Offer Pad was for 64.
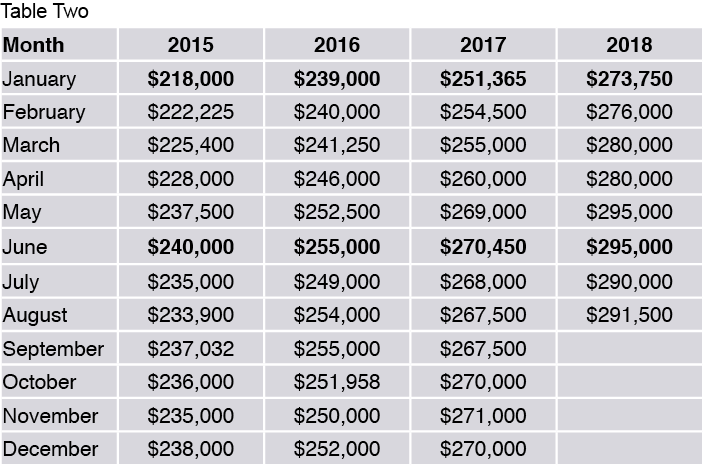
The Median Sale Price: It Goes Up and Up Then Goes Down in July
If you could buy a house like a stock and wanted to make a short-term gain, you would buy in January and sell in June.
The Table below shows the median sale price for a previously owned single family homes in Greater Phoenix (Maricopa County) by month for the years 2015, 2016, 2017 and the first eight months of 2018. As seen, in each year the month with the lowest median sale price is always January. Following January, the median sale price goes up each month or stays the same, then peaks in June. Following June there is a July price drop.
In a previous article for this publication I showed which months had the highest and lowest number of new monthly listings. The two months, historically, with the least number of new listings are November and December. While buyers will not have as many homes to choose from if looking to go under contract these two months, it may be the best time for a buyer to achieve the lowest purchase price. This may be a very good reasons why real estate agents should have a buyer campaign the last two months of the year.
While the numbers in Table Two paint a true picture of price trends for Greater Phoenix you must consider the fallacy of division. This fallacy involves that what may be true about a whole assumes that it must also necessarily be true of each part. In other words, the fallacy says the median sale price trend for Greater Phoenix must be true for every city, zip code and sub-division within Greater Phoenix. But we will not know if the price trend in Greater Phoenix holds true for a particular area without first doing the research. The good thing is there is plenty of information available for a real estate agent to analyze the price trend in the area in which they specialize.
Estimated Months of Supply by Residential Sold Price
The overall estimated months of supply was 1.9 months on September 5. When you break down the estimated months of supply by residential sold price range we see differences. Estimated months of supply is under a one month for homes listed below $200,000. Supply is at one month for listings $200,000 to $249,999. The estimated months of supply then goes up as the list price increases.
Employment Numbers for Greater Phoenix
As seen in Chart One below, year-over-year by month the number of people employed has increased every month this year compared to last year. In fact, there are 86,100 more people employed this July compared to last July!
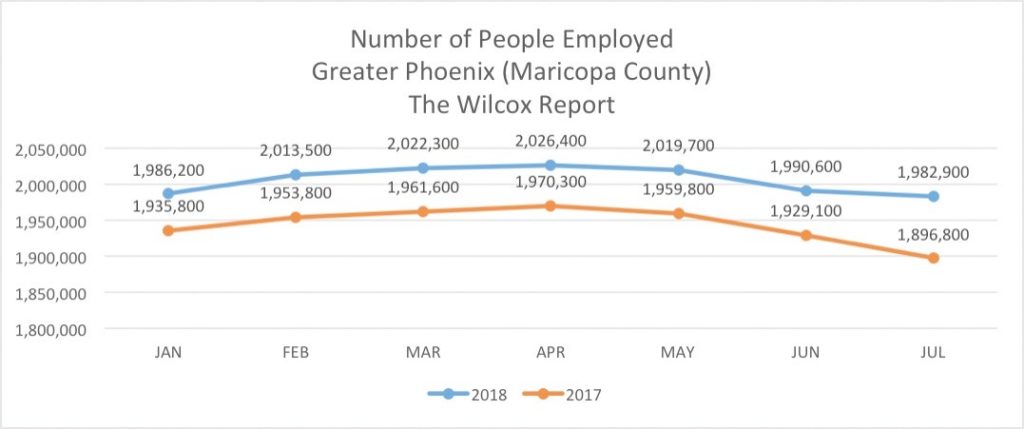
Data from Arizona Office of Economic Opportunity
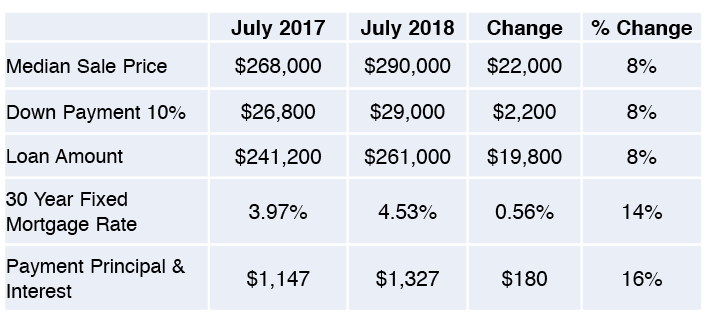
The Cost to Own Has Gone Up
Monthly principal and interest payments have gone up. According to the most recent data from Freddie Mac the thirty year fixed mortgage rate has been increasing. It was 4.53% in July 2018 compared to 3.97% in July 2017. This increase in the mortgage rate along with the increase in the median sale price has risen monthly principal and interest payments.
Table Four below compares what the monthly and principal interest payment would be if someone purchased a home for the median sale price, with ten percent down with the going thirty year fixed interest rate in July 2017 to 2018. The difference is a monthly payment increase of $180 dollars.
Conclusion
The price to own has gone up year-over-year due to rising home prices and interest rates. This will reduce some buyers from being able to qualify for a loan, however, the sheer increase in the number of people employed and who want to own, at this time, should more than compensate. Table Three appears to substantiate this with the low estimated months of supply in the most popular price ranges.
The information in Table Two does have implications as to when may be the best time for a seller to achieve the highest sale price and when may be the best time for a buyer to achieve the lowest sale price. A real estate agent by spending time analyzing price trends in their area of specialty will gain knowledge giving them a strategic advantage over their competition.