

Market Update: Number of Non-Owner Occupied Homes, Rental Rate Compared to Sale Price, Number of Sales by Year Built
November 27, 2018

Fletcher Wilcox
Grand Canyon Title Agency
According to Maricopa County records, there are approximately 1,043,844 single family residences. Twenty-six percent, or 271,730, are categorized as non-owner occupied.
How does a single-family residence get categorized as non-owner occupied? Arizona Revised Statutes requires that when there is a sale of a property and when that property is either a single family residence, a townhouse, a condominium, a two or four-plex, or a mobile or manufactured home, all buyers or their agents must check one of three boxes on a document titled the AFFIDAVIT OF PROPERTY VALUE. The three choices on this document are the following: A. The property is to be used as a primary residence. B. It is to be rented to someone other than a “qualified family member.” C. It is to be used as a non-primary or secondary residence. If box B or C is checked then the property is categorized as non-owner occupied.
Many of the properties categorized as non-owner occupied are rentals managed by a property management company.
Rental Rate for a Single-Family Residence Since 2000
Renting a single-family home is popular. Rental rates for single homes are increasing. The median monthly rental rate has increased for the past five consecutive years. Thus far in 2018, the median monthly rental rate is $1,550. This is the highest it has ever been. This is one hundred dollars higher than 2017 and four hundred dollars higher than 2013. Chart one shows the median monthly rental rate for a single-family residence for the years 2000 through 2018. The median rental rate for 2018 represents the combined months of January through October.
Comparing Rental Rate to Sale Price Since 2000
Chart two compares the median monthly rental rate to the median sale price for a single-family residence for the years 2000 through 2018. For the years 2000 through 2005, the median sale price went up, while the median monthly rental rate went down. For the years 2006 through 2009, it was the opposite. The rental rate went up or was steady while the sale price went crashing down. Starting in 2013 through 2018, thus far, both the sale price and rental rate have been going in the same direction. Both are up year-over-year.
What is a reason for the increases in both sale price and rental rate? More people with jobs. According to the U.S. Census Bureau from 2012 through 2017, the population in Maricopa County increased from 3,939,776 to 4,307,033 – an increase of 367,257 people. For the last two years, Maricopa County has led all counties in the United States in numeric population increase. Next year when the U.S. Census Bureau releases their population report, it is likely that Maricopa County for the third consecutive year will lead all counties in numeric population increase, in the range of 75,000 to 85,000 additional people. But people need jobs in order for housing demand to grow. When it comes to jobs, according to data I compiled from the Arizona Office of Economic Opportunity, there are 311,294 more people employed in 2018 than in 2012 in Maricopa County. The average number of people employed monthly in 2012 was 1,704,200 compared to 2,015,494 monthly employed in 2018 through September. All of these people have to live somewhere, and many prefer owning or renting a single-family residence.
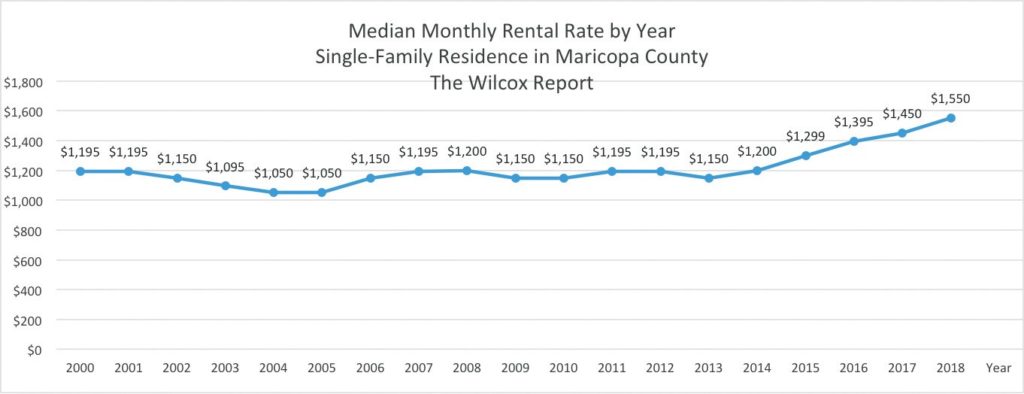
Chart 1 – Information compiled from ARMLS
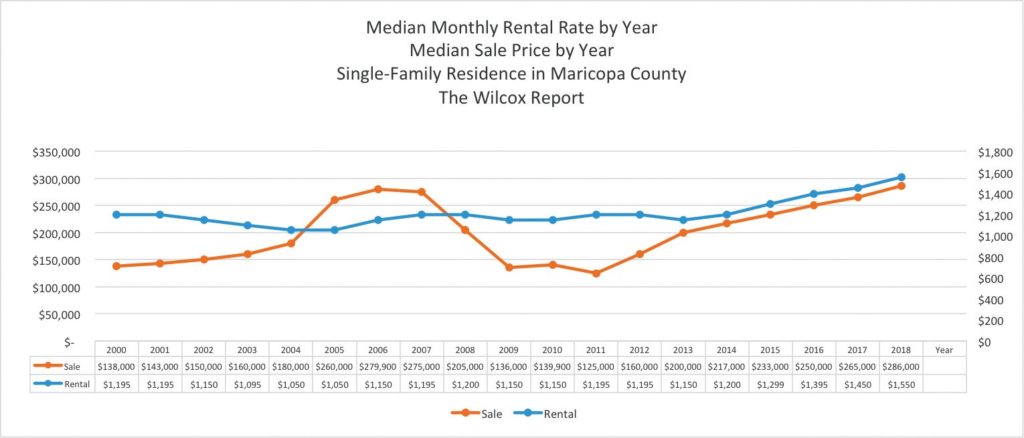
Chart 2 – Information compiled from ARMLS
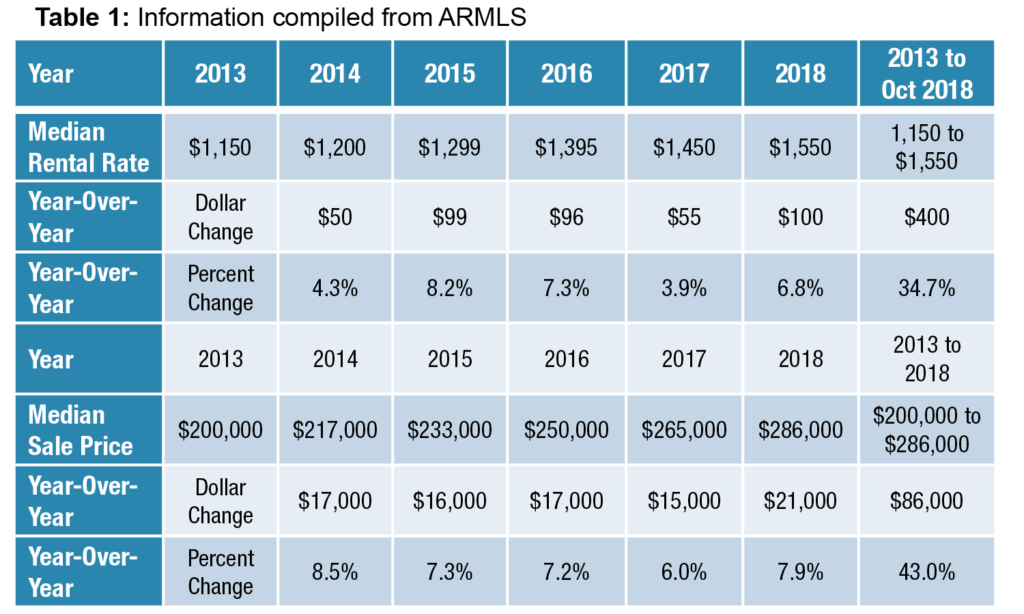
Which is going up Faster, the Rental Rate or the Sale Price?
Table One shows the year-over-year dollar and percentage increase of the median monthly rental rate and median sale price from 2013 to 2018. From 2013 through October 2018 the median sale price is up 43% compared to 34.7% for the median monthly rental rate.
Over Half of Single-Family Homes Sold in October were built before 2000
Table Two shows the number of single-family residences in Maricopa County sold in October by the year the home was built. Sixteen percent of sales were for homes built before 1975. Thirty-six percent of sales were for homes built from 1975 through 1999. Fifty-two percent of home sales were for homes built before 2000. Homes built in 2008 through 2017 accounted for only eleven percent of sales. Homes built in 2018 were five percent of October sales. Note: the information in this report is just for homes listed through the Arizona Regional Multiple Listings Services (ARMLS). Many new homes are not listed in ARMLS.
Look at the disparate numbers for homes sales and active listings for homes built in the years 2009, 2010, 2011, 2012. For homes built in these four years there were 493 active listings on November 1 out of 14,939 active listings. The most likely reason why active listings and sales are so low for these years is because few new homes were built in those years.
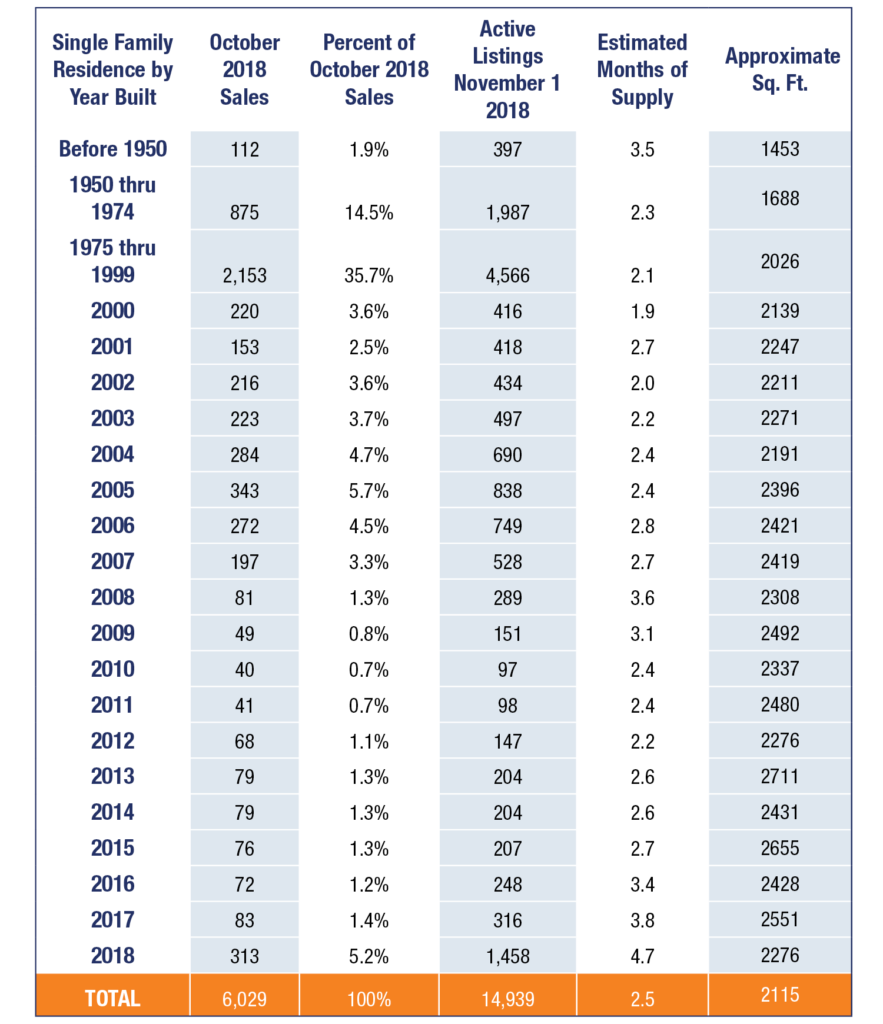
Table 2- Information compiled from ARMLS
Conclusion
Today we feel the effects of the real estate recession. Not like it was during the real estate recession when values were declining, but the opposite. Today, values are increasing because new home building during the real estate recession years of 2009 through 2012 did not create the supply of new homes needed for a growing population. Pressure on both sale prices and rental rates for single-family homes is likely to continue due to increasing demand and limited supply for properties in the most desired locations.
On another topic, at the beginning of this article I mentioned that there are 271,730 single-family homes that are categorized as non-owner occupied in Maricopa County and that many are managed by a property management company. If you are interested in learning more about managing single-family homes or in managing apartments, The Arizona School of Real Estate in Scottsdale will be hosting a property management seminar this December 14 from 9:00 a.m. to 12:30 pm.