

Market Update: Plenty of Opportunity in 2019 for Sales
April 30, 2019

Fletcher Wilcox
Grand Canyon Title Agency
Last month’s report showed that in Maricopa County (Greater Phoenix) year-over-year an increase in purchase prices, an increase in the number people employed, which means more potential homebuyers, while at the same time a decrease in the number of sales. This trend started in August 2018 and continues. There has been much local and national conjecture as to why sales are down year-over-year, not only here but elsewhere. This report will attempt to address this occurrence. There is also a lot of opportunity for real estate sales in 2019. But first, let’s review by price range, recent sales, active listings and estimated months of supply.
The information in this report was compiled from the Arizona Regional Multiple Listing Services, Inc. (ARMLS) data. The sales category is previously owned single-family homes in Maricopa County (Greater Phoenix). Table one shows by price range the number of sales and active listings and estimated months of supply. The sales are for February, the active listings are for March 25. The estimated months of supply are derived by dividing the number of active listings on March 25 by the number of February sales. Each sales price range shows the number of properties purchased with either cash, a conventional loan, an FHA loan, a VA loan or another type of financing. This is how you read Table one. In the sales price range of $200,000 to $249,999 there were 1,033 sales in February. This price range had the most sales of any price range. On March 25 there were 1,370 active listings. When dividing the active listings by sales it shows an estimated month of supply of 1.3 months. In this price range 173 properties were purchased with cash, 475 with a conventional loan, 276 with an FHA loan, 102 with a VA loan and seven with some other type of financing.
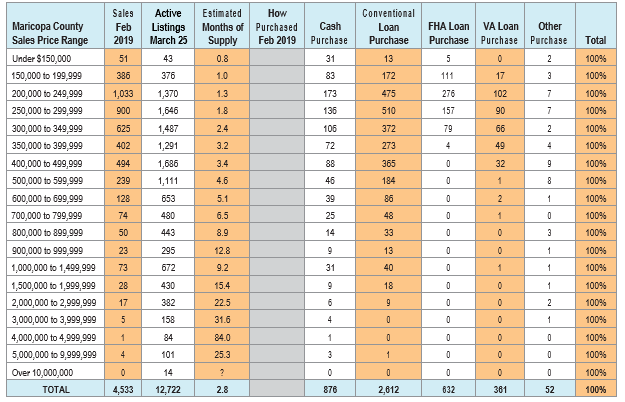
Market equilibrium, meaning neither a seller or buyer market, is thought to be about six months of estimated supply. Sales in the $200,000 to $249,999 price range have an estimated month of supply of 1.3 months. This suggests a very strong seller market. In all the price range categories under $350,000 the estimated months of supply were from .8 months to 2.4 months juxtapose to 9.2 estimated months of supply in the $1,000,000 to $1,499,999 price range.
Back to the Question
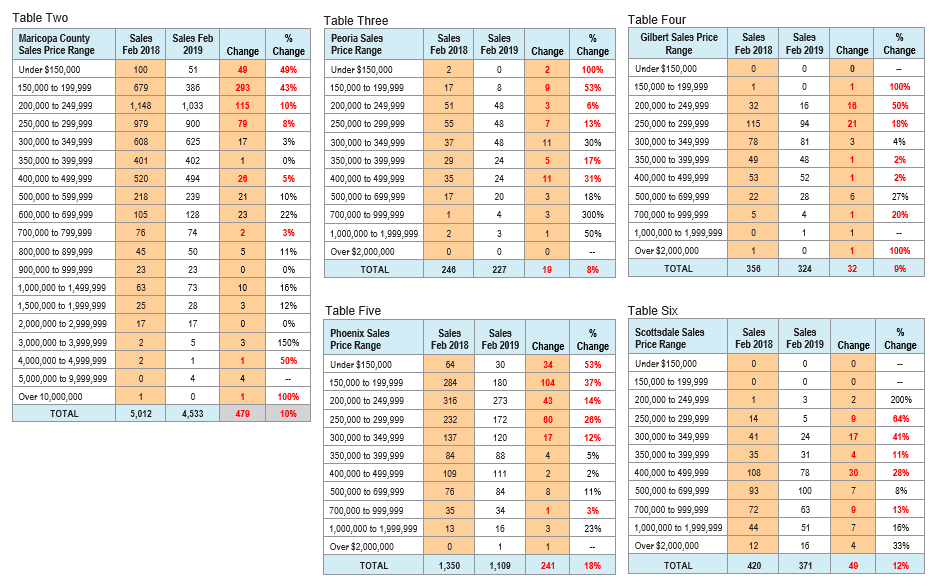
Why are sales down year-over-year? This is especially relevant, since there were 123,300 more people employed in 2018 than in 2016 in Maricopa County. To find a possible answer to this question I compared overall sales in February 2018 to February 2019. There were 479 or ten percent fewer sales in February 2019 than February 2018. See table two. I then compared February 2018 to February 2019 sales by price range to see if there were any differences. Differences found. For sales under $300,000 there were 536 fewer sales this February than last February. For sales over $300,000 there were 57 more in February 2019 than February 2018! Thus, the year-over-year drop in sales is in the lower, though most popular, sales price ranges and not in the higher prices ranges.
To go a little further, I compared sales by price range for four cities: Peoria, Gilbert, Phoenix and Scottsdale to see if there were any differences. Overall sales were down in each of these cities in February 2019 compared to February 2018. For each of these four cities I condensed the number of sales price ranges
Even though each of these four cities has a different median sales price range, Peoria the lowest and Scottsdale the highest, the results show that for each of them, year-over-year, there was a reduction in sales in their lower price ranges while the number of sales in the higher prices ranges actually increased, though slightly, in 2019. See tables three through six.
Peoria results: For sales under $300,000 there were 21 less compared to 2 more sales for sales of over $300,000. Gilbert results: For sales under $300,000 there were 38 less compared to 6 more sales for sales over $300,000.
Phoenix results: For sales under $350,000 there were 258 less compared to 17 more sales for sales over $350,000. Scottsdale results: For sales under $500,000 there were 58 less compared to 9 more for sales over $500,000.
The Next Question
Why did year-over-year sales go down mainly in the lower price ranges, but sales went up in many higher price ranges in Maricopa County?
In the lower price ranges the decrease in sales may be due to higher interest rates and rising prices. Year-over-year higher purchases prices along with increases in the rate of the thirty year fixed mortgage have increased a monthly principal and interest payment to the degree that priced out some buyers. Buyers take note: recently the thirty-year fixed mortgage rate is down ½ a percent compared to last year.
Overzealous sellers may be over pricing their homes to a point in which they are not appraising. Thus, the escrows are canceling. Many of these sellers will eventually lower their asking price.
Related to the above, is the lack of priced right inventory. Properties that are priced right in the lower price ranges usually have multiple offers. This means it may take a buyer several attempts before getting a contract accepted.
Buyer uncertainty. Buyers are waiting to see the future of the economy and/or political environment. The stock market.
Homes in the lower price ranges may have moved from a super-super-hot market to just a super-hot market due to all of the above. Thus lowering the number of sales.
What may be a reason why sales are up in the higher price ranges? The California wealth effect. In the February issue of this Journal, page 11, I showed net migration to Maricopa County and the negative migration from Cook County and California Counties. People are leaving California and moving to Arizona. Employers are leaving California and moving to Arizona.The result is what I call the California wealth effect. California’s corporate tax is 8.4% compared to Arizona’s 4.5%. California’s top individual tax rate is 13.30% compared to Arizona’s 4.54%. In 2019, if a couple has to pay taxes on $105,000, they will pay the state of California $9,765 more than double the $4,452 what they will pay to the state of Arizona. Then there is housing. Recently I met a couple with two children who left San Francisco to move to Scottsdale. Not only are they going to pay less in state taxes, but they also have a bigger home for less money. They purchased a home in Scottsdale for $700,000. This home cost less than the home they sold in San Francisco which had much less square footage. And they have close to one acre in Scottsdale, nowhere near what they had in San Francisco. Their friends in San Francisco, seeing pictures of their new home, asked if they lived in a park.
A related point on sales. We are in the peak listing season with plenty of sales to come. Historically, March through August are the months with the most sales in Maricopa County. The increases in job population and job growth and lower interest rates creates a tremendous opportunity for the real estate professional. In 2019 when combining sales for previously owned single-family homes, patio homes, condos and then add in new home sales this will add up to over 100,000 sales in Maricopa County this year with most of them yet to come.
Please send me your comments. Fletcher R. Wilcox Fwilcox@gcta.com 602.648.1230.