Greater Phoenix Residential Market
April 3, 2023
Greater Phoenix Residential Market
Launch Real Estate
4222 N. Marshall Way Ste A
Scottsdale, AZ 85251
602.648.1230
winston8415@outlook.com
Monthly Sales Show Improvement
Weekly Accepted Contracts Highest Number in Nine Months
Overall Purchase Price Holds Steady for Three Consecutive Months
Purchase Price for Thirty-Four Arizona Cities
Overall Median Purchase Price Holds Steady for Three Consecutive Months
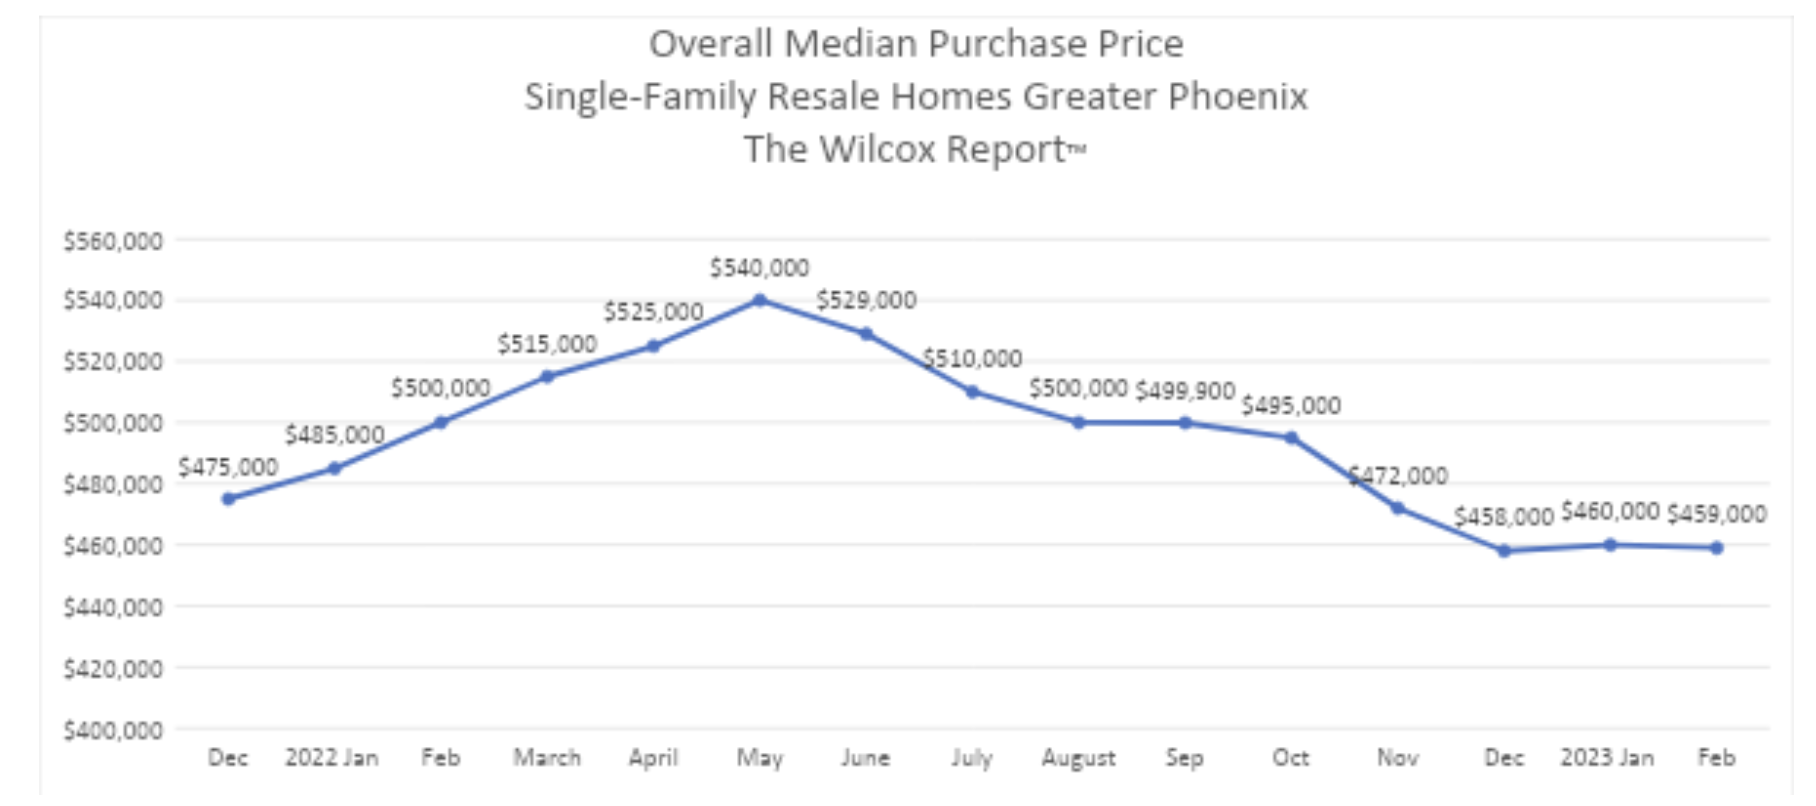
The median purchase price for a single-family resale home in Greater Phoenix in February was $459,000. It was $460,000 in January and $458,000 in December. See Chart One. This stabilizing of the median purchase price for the last three months is much different than from May 2022 through December 2022 when it fell $82,000 over this period for an average drop of $11,700 per month.
The February 2023 average purchase price per square foot was $284.02. In January 2023 it was $284.87. In February 2022 it was $301.11 for a YOY decrease of 6% ($17.09).
Purchase Price for Thirty-Four Cities
While Chart One shows the overall median purchase price, Table One shows the median purchase price for thirty-four Arizona cities year-over-year (YOY) and month-over-month (MOM). MOM, January to February, fifteen cities had an increase, fifteen cities had a decrease and four had no change, or a miniscule change. YOY the median purchase price was down in every city except Mesa, which had no change.
More February Highlights
-
- While high mortgage rates have dramatically decreased the number of sales, sales did improve in February. The number of sales in February 2023 were 3,735. This is 29% (1,528) less than February 2022. How is this an improvement in sales? The February YOY decrease of 29% in sales is less than January’s YOY decrease in sales of 38%. And the YOY decrease for the final three months of the 2022 fourth quarter averaged a 42% decrease!
- More evidence of sales improving is the number of weekly accepted contracts. Weekly accepted contracts in February were the highest since May 2022. See Chart Two. YOY weekly accepted contracts are down 14%, but this is no surprise with the doubling of the thirty-year fixed mortgage rate.
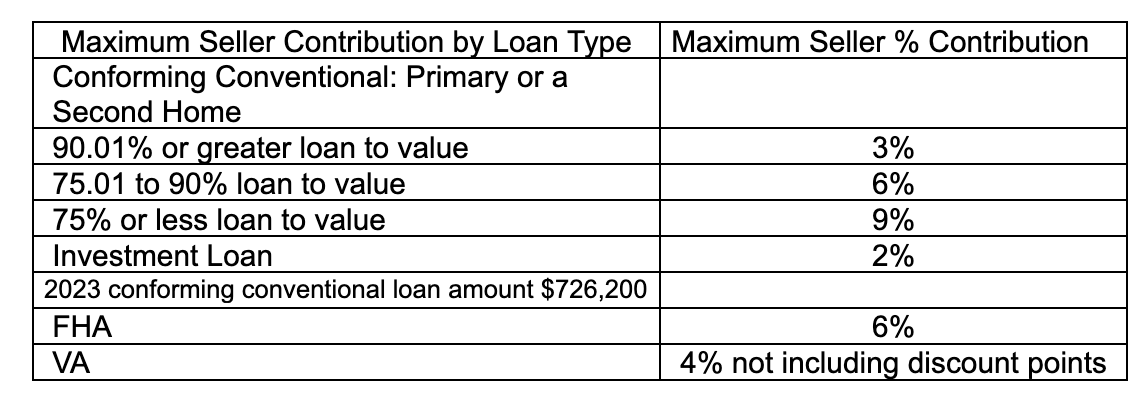
- Fifty percent of sales in February 2023 had a seller concession compared to 17% February 2022. See Table Two for maximum seller contribution by loan type.
- Not only has there been a large increase in the number of transactions with a seller concession, but there is a big increase in the median seller concession. In February this year, it was $10,000 compared to $3,000 last February.
- The number of February Notice of Trustee’s Sales (foreclosure notices) was historically very low. In February 2023, there were 321. In February 2022, there were 325. In February 2009, there were 8,394. The comparison of the number of Notice of Trustee’s Sales this February to February 2009 is an indicator that today’s residential market does not resemble the market crash of 2008 and 2009.
- Cumulative days on the market (CDOM) were 84 this February. Last February CDOM were 33. Seller’s need to know that it now takes a longer time to go under contract than last year.
- Total active listings this February were roughly 9,000 compared to 3,000 last February. Yet, total active listings are decreasing. In October 2022, there were 13,500 total active listings.
- The number of new monthly listings this February was the lowest in twenty years. This low number of new listings with a low number of sales is keeping down days of inventory. Days of inventory is approximately 65 days or just over two months. This is not a high number of days of inventory.
The information in this report is for single-family resale homes in Greater Phoenix. The information was compiled from the Arizona Regional Multiple Listing Services, Inc., and The Cromford Report.
Chart One:

Chart Two
 Table One: Median Purchase Price for 34 Cities
 Table Two: Know the Maximum Seller Percentage


