Greater Phoenix Residential Market
November 1, 2021

Fletcher Wilcox
V.P. Business Development and
Real Estate Analyst
Grand Canyon Title Agency
fwilcox@gcta.com
Founder TheWilcoxReport.com
Overall Purchase Price Index Stalls
Rents Slightly Increase
September Sales Up — September Listings Down
H.O.A. Addendum and Other Forms Update
In this report we compare sales, listings, median purchase price, and median monthly rent for single-family resale homes in Greater Phoenix. The information in this report was compiled from Arizona Regional Multiple Listings Services, Inc. data. This report review trends by comparing the first three quarters of 2021 to 2020, September 2021 to September 2020 and September 2021 to August 2021.
The number of sales for the first three quarters of 2021 are up 2,675 or 5% compared to the first three quarters of 2020. When comparing September 2021 sales to September 2020 sales they were down 347 or 5%. However, September 2021 sales were 294 or 5% higher than August 2021 sales.
Listings for the first three quarters of 2021 are up 1% compared to the first three quarters of 2020. Listings in September 2021 compared to September 2020 are down 970 or 13%. Listings in September 2021 are down 820 or 11% compared to August 2021. See Table One for a monthly comparison of listings and sales.
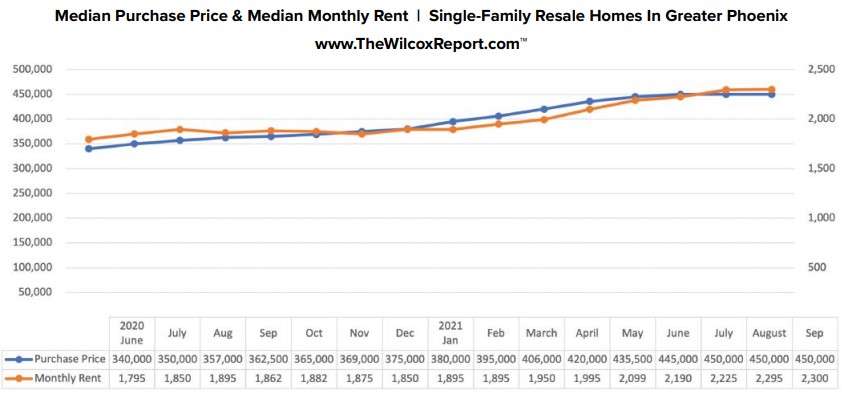
The overall median purchase price for single-family resale homes in Greater Phoenix has stalled. For the third consecutive month it was $450,000. This is after fourteen consecutive months of increases in the overall median purchase price. See Chart One. However, when we break out the median purchase price by city and compare September numbers to August numbers the median purchase price was down in nine cities and up in seventeen cities. See Table Two. Median month rent was up slightly in September. It was $2,300 which is $5 more than August. September’s median monthly rent is an all-time high.
Table Three compares 26 cities year-over-year for September 2021 to September 2020 for sales, listings and median purchase price and median monthly rent.
October 2021 Forms Update: Arizona Association of REALTORS
On October 1, the Arizona Association of REALTORS released revisions to the following forms: the H.O.A. Condominium / Planned Community Addendum, the Multiple Counter Offer and the Vacant Land/Lot Seller’s Property Disclosure Statement. H.O.A. scenario: Just before close of escrow there was an H.O.A. fee that was not identified on the H.O.A. addendum. The escrow officer contacted the agents and asked them who was going to pay the fee. The seller’s agent said the buyer was to pay the fee. The buyer’s agent said the seller was to pay the fee. So now what happens? Well, the revised H.O.A. Condominium / Planned Community Addendum addresses this scenario. Added to the Addendum is Line 75. It says Any additional fees not identified on page 1 and not disclosed and payable by the close of escrow shall be paid by ___Buyer, ___Seller___Other. Now just remember to check who is going to pay if this happens. The revised Multiple Counter Offer. The following language was added to this document on lines 40-43. Signature by Seller below and delivery to Buyer or Buyer’s broker as indicated above creates a binding agreement. Seller agrees to revoke all counter offers previously conveyed to other prospective Buyers by separate notice and agrees to sell Premises to Buyer. Except as modified by this Multiple Counter Offer, all other terms and conditions of the above referenced Offer/Counter Offer(s) shall remain unchanged and deemed accepted. This language was added to stop the dilemma of a seller selling to more than one buyer. The Vacant Land/Lot Seller’s Property Disclosure Statement. There were quite a few changes made to this document. To review changes, go to vacant land and lot sellers disclosure-statement.
Conclusion and Looking Ahead
I expect the October overall median purchase price for a single-family resale homes to be higher than $450,000 in October setting a new record. Some cities will have record highs while some cities may have small decreases.
Chart One: Overall Median Purchase Price Index for Greater Phoenix

Table One: Monthly Sales and Listings

Table Two: Comparison of Median Purchase Price August 2021 to September 2021

Table Three: Twenty-Six City Year-Over-Year Comparison


